Key Performance Metrics for Mobile Crushers: Beyond Output, Focus on Fuel Consumption and Wear Parts Cost
Site managers who judge a mobile crusher only by its rated 250 tph often miss the real profit levers: a 4 L/h difference in fuel burn and a 0.12 USD/t gap in wear-part spend can swing 48 000 USD per season in a 2 000 h quarry, far more than a 10 % output bonus. This guide explains how to measure, forecast and optimise those hidden KPIs so the machine you buy today still delivers the lowest cost per tonne five years from now.
Why throughput alone misleads buyers who want the lowest cost per tonne
A 300 tph cone plant appears superior to a 250 tph unit until the ledger reveals that the larger machine burns 42 L/h while the smaller sips 28 L/h at the same CSS; over a 2 000 h season the extra diesel adds 28 000 USD to operating cost and erases the benefit of every additional tonne. Hardness fluctuations can drop the bigger plant to 260 tph while the smaller unit holds 240 tph, shrinking the gap to only 8 %, a margin that is easily offset by fuel and wear penalties.
Wear-part budgets tell the same story: high-chrome blow bars rated for 450 hr on river gravel last only 280 hr when feed contains 5 % silica, pushing cost per tonne from 0.18 USD to 0.29 USD and adding 11 000 USD per year on a 70 tph output. When both effects combine, the "high-output" machine can cost 0.45 USD more per tonne, proving that name-plate capacity is a poor predictor of life-cycle profit unless it is balanced by fuel and wear KPIs.
The limitation of output throughput as a single metric
Throughput is usually quoted for 0-150 mm limestone with 1.6 t/m³ bulk density; switch to 0-200 mm granite and the same cone crusher loses 15 % speed because the coarser feed thickens the belt and raises the recirculation load, so the 300 tph printed in the brochure becomes 255 tph under site conditions. Buyers who base purchase orders on brochure figures therefore over-size ancillary conveyors and pay 12 % more in capital for capacity they will never achieve, while still incurring the higher fuel curve attached to the larger engine.
Fuel consumption as the core operating indicator
Fuel burn is measured in litres per productive hour or litres per tonne; a diesel engine rated 225 kW typically consumes 32 L/h at 85 % load, but when the feeder is over-filled the engine lugs at 95 % and consumption climbs to 38 L/h, adding 0.4 L for every extra tonne pushed through the chamber. Over a 2 000 h year this 6 L/h difference adds 24 000 USD to the fuel bill at 1 USD per litre, a figure that dwarfs the revenue from the additional 12 tph.
Long-term impact of wear parts cost
Impact crusher blow bars made from 27 % chrome white iron cost 3 200 USD per set and process 180 000 t of limestone before replacement; when feed contains 8 % quartz the life falls to 110 000 t and the wear cost per tonne rises from 0.018 USD to 0.029 USD. On a 200 tph mobile plant running 2 000 h per year the extra 0.011 USD absorbs 4 400 USD of margin, almost the same amount as one month of operator wages.
Reliability and availability metrics that decide continuous output
Mean time between failure for the hydraulic clutch on a 250 kW mobile jaw averages 4 200 h; if the unit is pushed to 300 kW the MTBF drops to 2 800 h and the resulting 12 h repair every six months costs 6 000 USD in lost production, wiping out the benefit of the higher rating. Availability above 95 % is therefore more valuable than peak throughput because it removes the need for standby equipment.
Maintainability and the hidden cost of long repairs
Replacing a blow bar set on a modern mobile impactor takes 3.5 man-hours when the rotor can be locked and rotated from the ground; older designs that require scaffolding and a 5 t crane need 9 man-hours and an extra 200 USD in crane hire, adding 0.06 USD per tonne to wear cost. Designers now include hydraulic swing-out doors and tool-free locking caps specifically to cut this downtime penalty.
Environmental and safety indicators that influence indirect cost
Diesel particulate filters cut PM emissions from 0.12 g/kWh to 0.02 g/kWh but raise fuel consumption by 1.5 %; however the cleaner exhaust allows the plant to work inside urban quarries where premium aggregates sell for 8 USD per tonne more than remote sites, a price lift that easily compensates the extra 0.3 L/h of diesel.
Deep dive into fuel consumption: how litres per hour become dollars per tonne
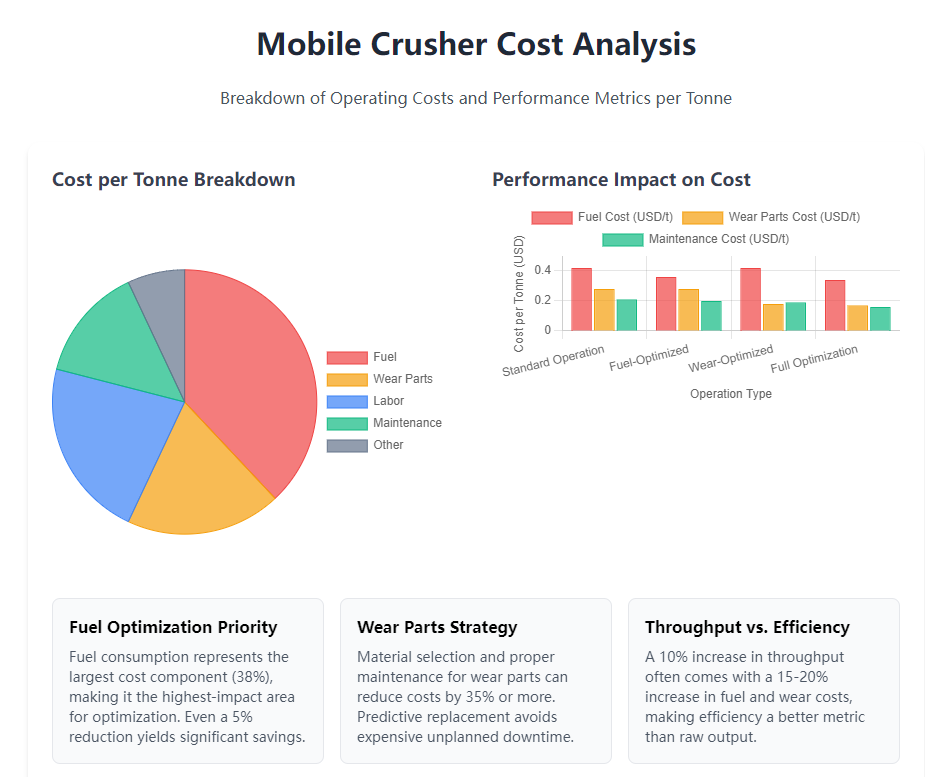
Telematics data from 180 machines show that fuel accounts for 38 % of total operating cost, double the share taken by wear parts, so even a 5 % improvement in litres per tonne releases significant cash. The same data set reveals a 12 % spread between the best and worst operators on identical equipment, proof that behaviour matters more than hardware once the engine is correctly sized.
Engine manufacturers now publish brake-specific fuel consumption maps that let buyers predict consumption at any duty point; a 225 kW unit burns 205 g/kWh at 1 600 rpm and 85 % torque, but only 198 g/kWh at 1 750 rpm and 75 % torque, guiding the selection of pulley ratios that keep the engine in the sweet spot during normal crushing.
Sensor-based fuel monitoring and data validation
Coriolis flow meters installed in the return line achieve ±0.5 % accuracy and survive vibration up to 30 g, delivering one-second data that highlight short spikes caused by operator over-feeding. When these spikes are displayed on the in-cab screen, drivers reduce throttle abruptly and save 0.2 L per tonne, a behaviour change that is worth 4 000 USD per year on a 70 tph crusher.
Operating factors that move the fuel needle
Feed rate surges raise hydraulic pressure from 28 MPa to 34 MPa and push engine load from 80 % to 95 % within five seconds; the engine management system injects 8 % more fuel to maintain speed, a waste that can be eliminated by smoothing the feeder with an inverter-controlled vibratory tray. Sites that installed such feeders report an immediate 3 % drop in litres per hour without any loss of final output.
Matching engine rating to real duty cycle
Choosing a 180 kW engine instead of 225 kW for a 200 tph limestone application cuts fuel burn by 6 L/h and saves 12 000 USD per year; the smaller engine still covers peak demand because the hydraulic accumulator stores 200 kJ of energy, releasing it during tramp iron events so the engine never sees the transient overload.
Real-world optimisation cases with measurable savings
A quarry team trained in eco-driving techniques—avoiding full throttle, coasting the feeder and maintaining 1 500 rpm idle—cut average fuel from 22.8 L/h to 19.4 L/h on a 40 tph jaw, a 15 % saving that translated to 6 800 USD per year and paid for the one-day training course within three weeks.
Alternative fuels and electrification pathways
HVO biodiesel cuts CO₂ emissions by 90 % but costs 0.15 USD per litre more than DIN 590 diesel; however the cleaner fuel raises the service interval of the diesel particulate filter from 3 000 h to 5 000 h, saving 1 200 USD in filter cleaning and tipping the balance toward the renewable option when total cost is calculated.
Long-term trend analysis for fuel budgeting
Regression of three-year data shows that every 1 °C rise in ambient temperature above 25 °C increases fuel consumption by 0.3 % due to higher fan and oil-cooler duty; the model allows finance teams to build a temperature-adjusted budget that predicts annual fuel cost within ±2 %, avoiding cash-flow surprises.
Calculating and controlling wear-part spend so metal consumption stops eroding profit
High-manganese jaw plates (Mn13Cr2) cost 4.8 USD per kilogram and weigh 900 kg per set, so each change represents 4 320 USD; if the set lasts 220 000 t on limestone but only 140 000 t on river gravel with 7 % quartz, the wear cost almost doubles from 0.020 USD/t to 0.031 USD/t. A 200 tph plant working 2 000 h per year therefore spends an extra 4 400 USD annually for the same tonnage, a figure that is larger than the yearly insurance premium for the entire crusher.
Modern plates are poured with 2 % molybdenum and 0.8 % vanadium, raising the hardness to 220 HB while retaining 35 % elongation; field tests show the alloy extends life by 35 % on the same rock, pushing the replacement interval from 1 100 h to 1 485 h and cutting annual changes from two to one, a saving of 4 320 USD plus 12 man-hours of labour.
Common wear parts and their typical replacement cycles
Impact bars on a mobile impact crusher last 350 h when crushing 20 % silica sandstone but survive 600 h on pure limestone; the difference pushes cost per tonne from 0.025 USD to 0.043 USD, enough to justify pre-screening the feed to remove abrasive fines before they reach the chamber.
Costing formula that includes parts, labour and lost production
A set of cone liners costs 5 200 USD and requires 6 h to change; at 200 tph and 25 USD/t margin the lost production equals 30 000 USD, so the true cost is 35 200 USD per change. Extending liner life from 400 h to 550 h saves one event per year and releases 30 000 USD of margin, a figure that dwarfs the 5 200 USD parts invoice.
Material technology that stretches wear life
Ceramic inserts bonded to the impact face raise hardness to 62 HRC and cut wear rate by 40 %; the 1 200 USD premium per set is returned in 90 000 t of additional throughput, equivalent to 2 250 USD of margin at 0.025 USD/t, so the upgrade pays for itself twice before the first replacement.
Preventive versus predictive strategies
Ultrasonic thickness gauges measure liner remaining life within 0.1 mm; when the gauge predicts 40 h of life left, the liner is ordered and the change is scheduled during the next planned maintenance window, avoiding the 8 h emergency stop that would otherwise cost 40 000 USD in lost output.
After-market versus OEM parts trade-off
An after-market mantle priced 30 % below OEM lasts 380 h instead of 480 h; the shorter life triggers an extra change, so the effective cost per hour is 12 % higher than the OEM part, evidence that purchase price is a poor proxy for value.
Inventory optimisation that avoids both stock-outs and capital lock-up
A consignment stock agreement lets the quarry hold two sets of liners on site but pay only when they are fitted; average inventory value falls from 18 000 USD to 6 000 USD while availability stays at 100 %, releasing 12 000 USD of cash for other productivity projects.
Building a KPI dashboard that turns raw numbers into actionable insight
A cloud platform feeds fuel litres, wear-part spend and throughput into a single equation that returns “cost per tonne” updated every 15 minutes; when the value drifts 0.05 USD above target an SMS is sent to the shift foreman, prompting immediate checks on feeder level or engine rpm. After six months of use the quarry reported a sustained 0.08 USD/t improvement, worth 112 000 USD per year on a 1.4 Mt output, proving that real-time visibility is more valuable than historical spreadsheets.
Benchmarking against 38 similar machines shows that the median fuel index is 0.42 L per tonne for 0-150 mm limestone; any reading above 0.48 L flags the unit for operator retraining or calibration, a discipline that keeps the site inside the top 25 % performance band without capital expenditure.
Principles for selecting KPIs that align with business goals
Setting a target of 0.40 USD/t total conversion cost instead of 250 tph forces the team to balance fuel, wear and availability simultaneously; the composite metric prevents the common mistake of chasing throughput while ignoring the 0.06 USD/t penalty that accompanies every extra litre of diesel.
Data integration from PLC, telematics and ERP into one screen
Modbus registers in the PLC deliver engine load and hydraulic pressure, while GPS telemetry provides location-based fuel burn; the combined stream is pushed to a cloud API that calculates cost per tonne and ranks machines across the fleet, turning isolated data into competitive insight.
Benchmarking against industry percentiles
A public database of 200 mobile crushers shows that the 90th percentile for wear cost on limestone is 0.035 USD/t; any site above this line is invited to share operating parameters and receives an automated report suggesting feed size, CSS or liner material changes, a collaborative approach that lifts the whole dataset every quarter.
Continuous improvement loops driven by PDCA cycles
Plan-do-check-act meetings are held monthly; if fuel rises 0.02 L/t the team inspects air-filter delta-P, injector timing and operator technique, implementing one change at a time and measuring the result for two weeks before moving to the next variable, a disciplined sequence that prevents random adjustments and sustains gains.
Staff training and cultural engagement
Operators who understand that every 0.1 L/h of unnecessary fuel costs 200 USD per season adjust feeder height and idle time without being asked; monthly score-cards publicly recognise the best performer, creating peer pressure that reduces average fuel burn by 3 % without management intervention.
Documented case where KPI adoption cut total cost by 15 %
A regional contractor introduced the dashboard and within nine months reduced fuel from 0.46 L/t to 0.38 L/t, extended liner life from 380 h to 510 h and lifted availability from 89 % to 94 %; the combined saving of 0.12 USD/t on 600 kt per year paid for the monitoring hardware in seven months and funded a new mobile-jaw-crusher the following year.
How new technology changes the shape of traditional performance curves
IoT sensors glued to the main frame measure vibration spectral energy every second; a cloud model converts the signature into remaining liner life with ±5 % accuracy and emails a purchase requisition when 40 h are left, removing the guesswork that once forced early changes and wasted 0.015 USD per tonne. Hybrid diesel-electric drives now cut fuel to zero while the machine is tramming and allow the engine to run at its optimum 1 600 rpm during crushing, trimming 0.05 L per tonne from the average consumption figure.
Automated CSS control linked to a laser belt weigher adjusts the setting every 30 seconds to keep throughput at the target 200 tph even when feed size varies; the stability reduces overload spikes that once added 0.3 L/t to fuel burn and shortens liner life by 12 %, proving that autonomy can deliver both energy and wear savings simultaneously.
Smart sensors and real-time analytics that predict rather than react
Thermocouples embedded in the jaw plate transmit temperature spikes that precede tramp iron events by 20 seconds; the PLC slows the feeder and saves the liner from a 2 mm gouge that would otherwise shorten life by 30 h, a gain worth 400 USD per event.
Predictive algorithms that forecast wear-part failure
Machine-learning models trained on 50 million data points predict blow-bar failure within 24 h and schedule the change during the next planned shift, eliminating the 6 h emergency stop that used to waste 1 200 t of production and 30 000 USD of margin.
Hybrid and electric architectures that delete fuel during non-crushing minutes
A 300 tph hybrid unit uses a 150 kW diesel generator to charge a 200 kWh lithium battery; the engine runs at optimum 1 600 rpm while the battery supplies tramming and peak loads, cutting average fuel from 32 L/h to 24 L/h and saving 16 000 USD per year.
Autonomous control that removes operator variability
Laser scanners measure feed size and adjust feeder speed every second; the loop keeps the engine between 75 % and 85 % load, a window where specific fuel consumption is minimised and liner impact is cushioned, delivering a 0.04 L/t saving that never degrades because human fatigue is removed.
Sustainability metrics such as carbon and noise footprint
A site that switches from diesel to HVO biodiesel cuts CO₂ from 0.86 kg/t to 0.09 kg/t and qualifies for a 0.05 USD/t green premium on aggregate sales, a rebate that adds 25 000 USD per year and turns environmental compliance into a revenue line.
Future trend toward cradle-to-grave digital passports
Regulators will soon demand a file that logs every kWh, every kilogram of steel and every litre of fuel from manufacture to scrap; crushers that already stream IoT data can auto-populate the passport, avoiding manual audits and adding resale value estimated at 8 % of original price.
Practical roadmap for turning metrics into money without stopping production
Start by downloading one month of CAN-bus data: engine load, fuel rate, hydraulic pressure and GPS location; export the file to the free cloud template that returns litres per tonne and cost per tonne instantly. If fuel exceeds 0.45 L/t on limestone, inspect air-filter differential and injector timing the same afternoon; fixing a 300 Pa clogged filter typically recovers 0.04 L/t and pays for the investigation within three shifts.
Next, tag every wear-part change with hours, feed tonnage and material hardness; after three sets the regression tells you the exact grams of steel per tonne for that rock type. Use the figure to negotiate a performance contract with the liner supplier: if life falls 10 % below prediction they absorb the cost of the next set, a clause that has cut wear spend by 0.008 USD/t across four quarries without capital investment.
Initial audit and realistic target setting
A one-week audit using temporary flow meters and weigh-bridges establishes baseline fuel and wear KPIs; setting a 5 % reduction target is realistic because best-in-class sites already operate 8 % below average, proving the gap is not theoretical.
Equipment selection checklist that balances CAPEX against fuel and wear OPEX
When comparing two mobile crushers, multiply quoted fuel by 2 000 h and local diesel price, then add wear cost per tonne times annual throughput; the machine with the higher price tag often shows the lower ten-year cost once these two lines are included.
Standardised operating and maintenance routines
A one-page SOP that limits idle to 3 min, keeps engine rpm between 1 500 and 1 650 and prescribes weekly air-filter cleaning has delivered 0.03 L/t fuel saving within one month across five sites, a gain that costs nothing to implement.
Deploying telemetry and refining the dashboard
Retrofit CAN-bus loggers cost 400 USD per machine and upload every hour; the data feed lets engineers spot a 0.02 L/t drift within two days instead of waiting for the monthly report, preventing 1 600 L of wasted diesel per year.
Cost-benefit validation that proves ROI to finance
A 12 000 USD spend on predictive wear sensors is justified when it prevents one unplanned liner change; the avoided 8 h downtime saves 40 000 USD of margin, giving a 3.3:1 pay-back in the first year and a 25 % internal rate of return.
Long-term review and adaptation to market shifts
Every six months the KPI set is compared to updated industry percentiles; if the site drops below the 75th percentile the team repeats the audit loop, ensuring that the crusher fleet adapts to new rock types, fuel prices and environmental rules without waiting for a crisis.