Comprehensive Guide to Gear Wear Detection for Cone Crushers: 2025 Standardized Testing Procedures
Gear systems are critical components in cone crushers, which play a vital role in processing materials like granite, basalt, and iron ore into manageable aggregates. As cone crushers operate under high mechanical stress, their gears are prone to wear over time—including issues like pitting, spalling, and tooth thickness reduction. This guide is designed to provide a clear, standardized framework for detecting gear wear, adhering to international standards such as ISO 10816 for vibration testing and AGMA 9-FTM for contact fatigue evaluation. It covers essential aspects from detection methodologies and tool requirements to wear assessment criteria, testing cycles, data analysis, and preventive maintenance. Whether you are a maintenance technician, industry professional, or student learning about industrial machinery, this guide offers practical, data-backed insights to ensure the reliable operation of cone crushers and extend their gear service life.
Gear Wear Detection Methodologies
Detecting gear wear in cone crushers requires a combination of visual, dimensional, and dynamic testing methods. Each methodology targets specific types of wear, ensuring no potential issue is overlooked. Visual inspections identify surface defects like pitting, while dimensional measurements quantify changes in tooth thickness and side clearance. Dynamic methods such as vibration analysis, meanwhile, capture early signs of internal wear that may not be visible to the naked eye. By integrating these approaches, technicians can create a complete picture of gear health and address problems before they lead to costly breakdowns.
Visual Inspection Standards (Tooth Pitting/Spalling)
Visual inspection is the first line of defense in detecting gear wear, focusing on identifying surface damage like pitting and spalling. Pitting appears as small, crater-like holes on the tooth surface, caused by repeated contact stress that leads to material fatigue. Spalling, by contrast, involves larger flakes of material peeling away from the tooth, often indicating advanced wear or improper lubrication. For cone crusher gears, the visual inspection standard specifies that pitting area should not exceed 5% of the total tooth surface—any higher indicates a need for further evaluation or repair.
To perform an effective visual inspection, technicians must first clean the gear surface to remove dirt, grease, and debris, which can obscure defects. Using a magnifying glass (10-20x magnification) helps identify small pitting or early-stage spalling. Additionally, inspectors should check for uneven wear patterns, which may signal misalignment or improper load distribution. For example, if wear is concentrated on one side of the tooth, it could indicate issues with the transmission shaft alignment, a common cause of uneven gear stress in cone crushers.
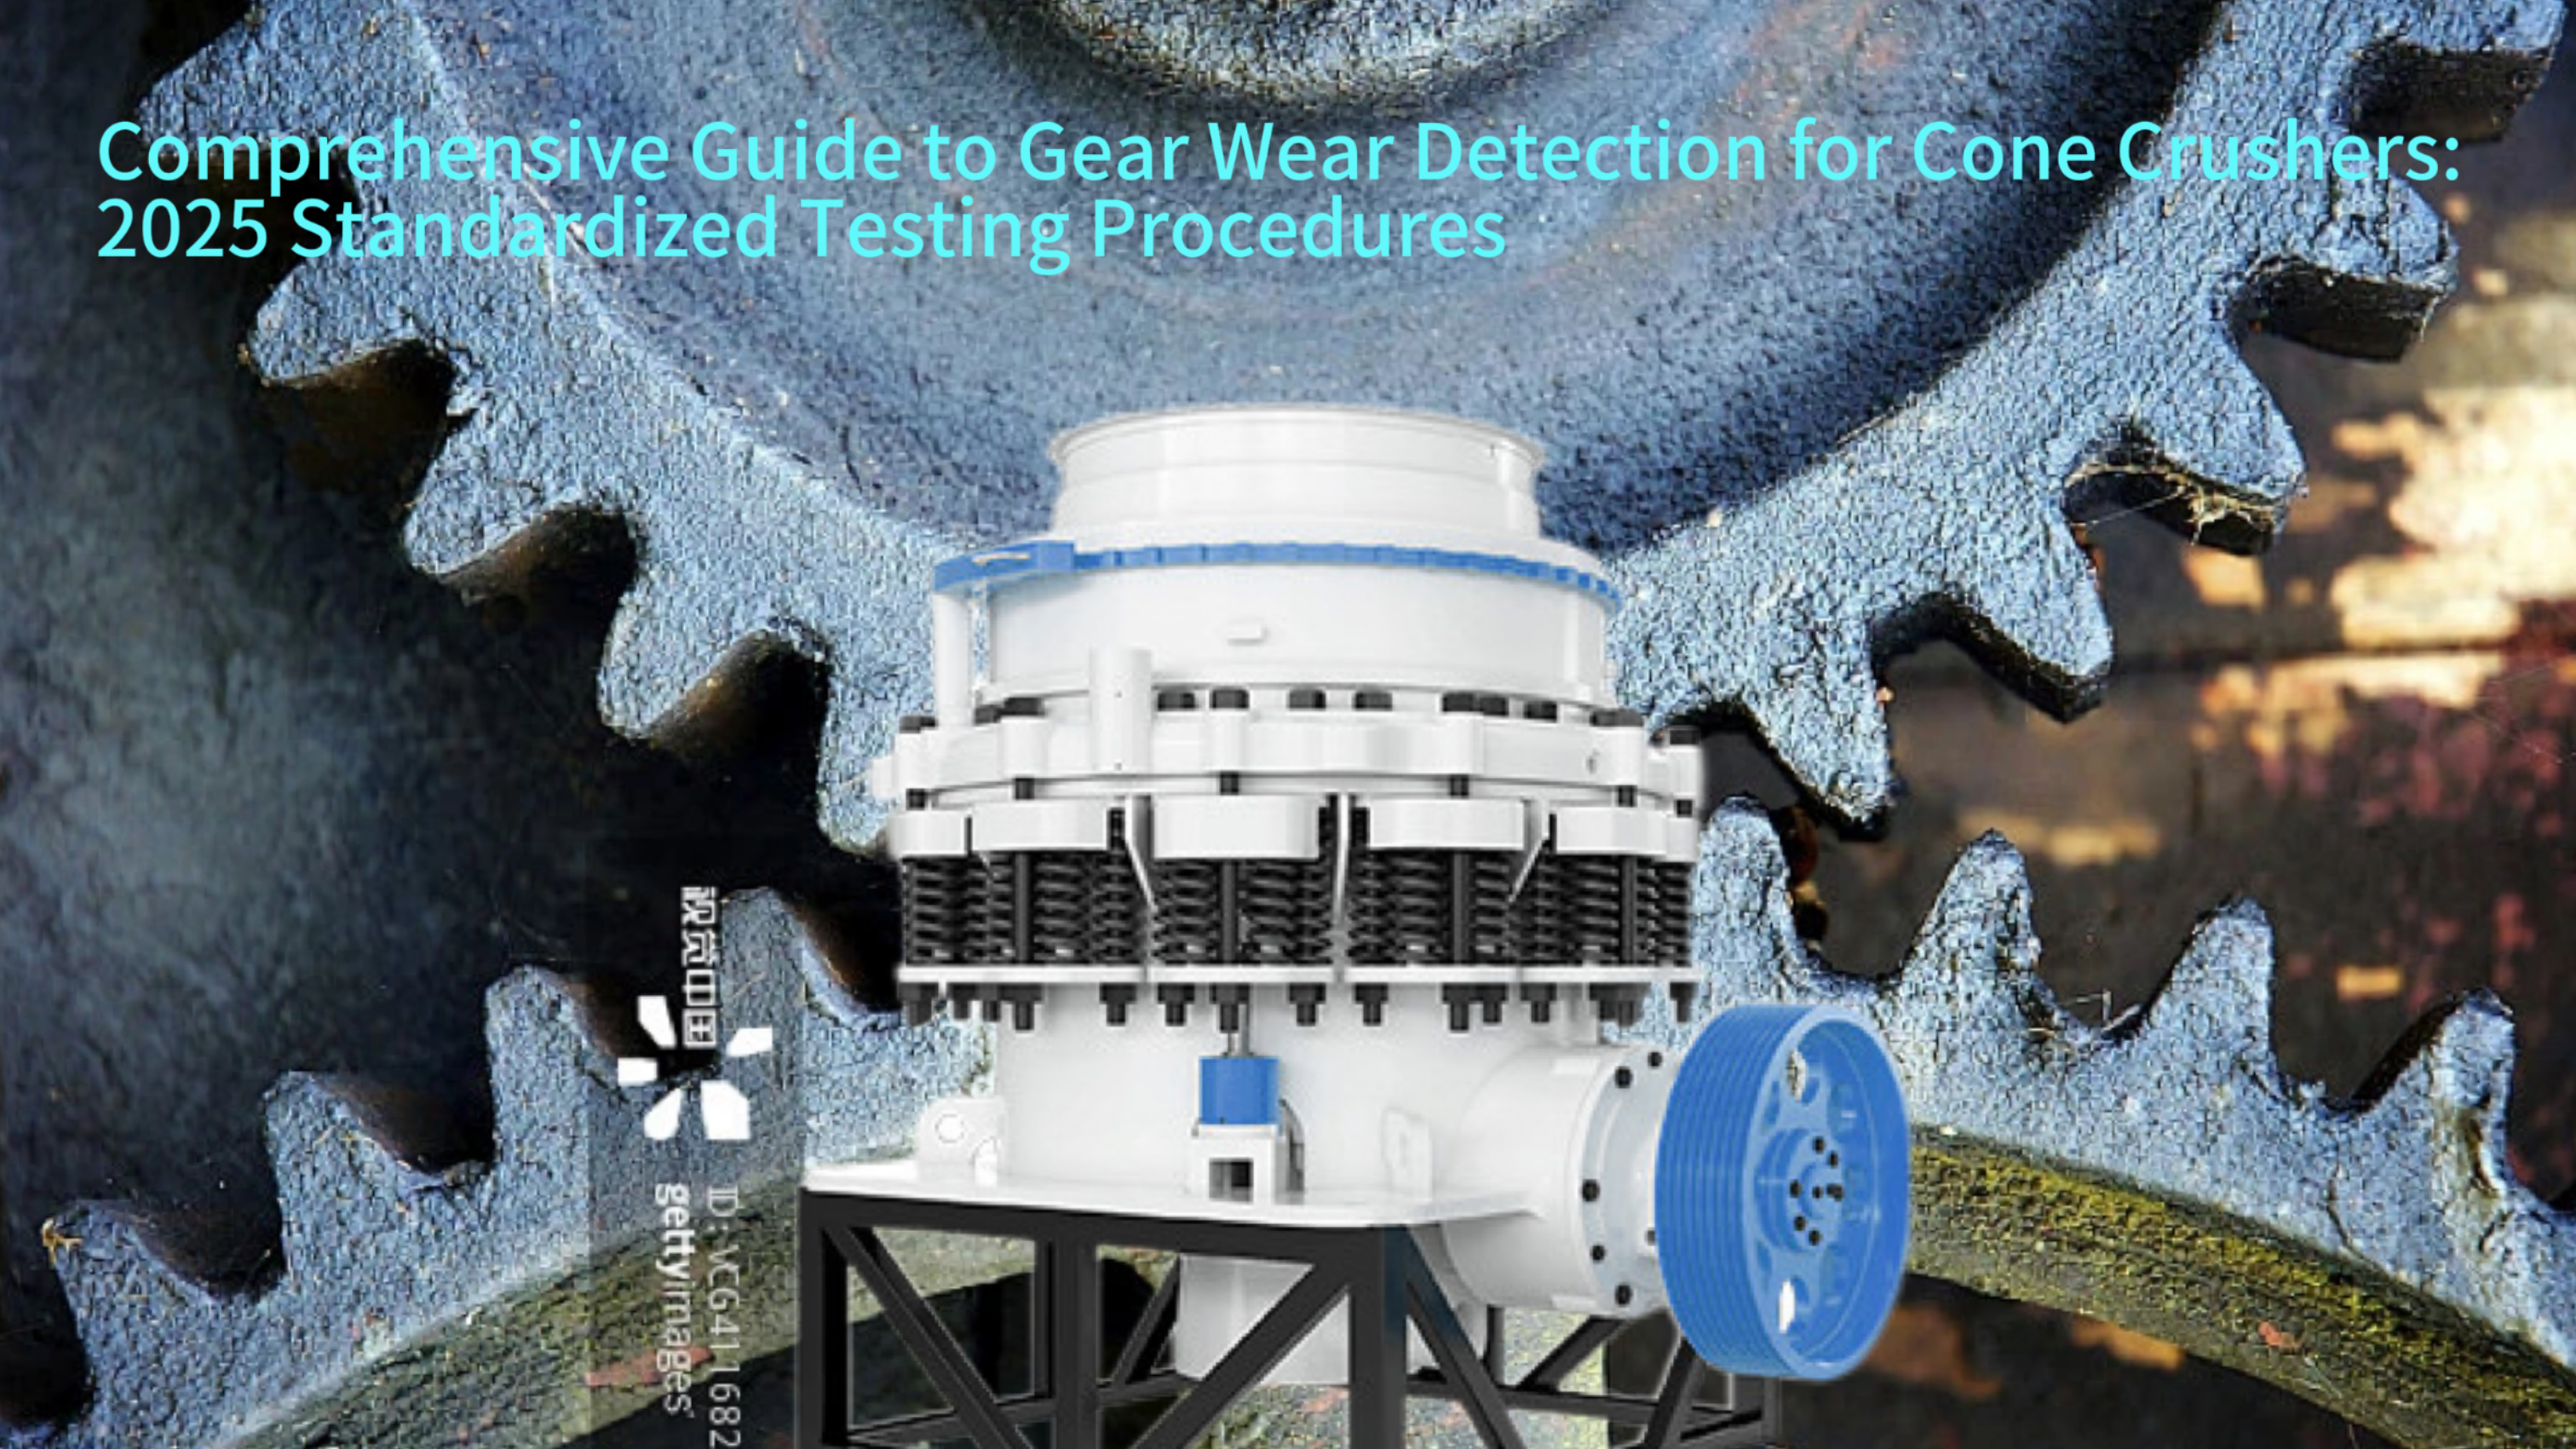
.png")
Tooth Thickness Measurement Techniques (Tooth Calipers/Coordinate Measuring Machines)
Tooth thickness is a critical dimensional parameter for assessing gear wear—reduced thickness directly impacts gear meshing efficiency and load-bearing capacity. Two primary tools are used for this measurement: tooth calipers and coordinate measuring machines (CMMs). Tooth calipers are portable and ideal for on-site testing, with a typical accuracy of ±0.01mm. They measure the thickness of the tooth at a specified distance from the tooth tip (known as the "reference circle"), a standard defined by gear design specifications. For cone crusher gears, the reference circle is usually set at 70-80% of the tooth height to ensure consistent measurements.
CMMs, on the other hand, offer higher precision (up to ±0.005mm) and are used for detailed, laboratory-style analysis. These machines use a probe to map the entire tooth profile, capturing not just thickness but also deviations in tooth shape—such as tapering or rounding—that may indicate uneven wear. Before measurement, both tools require the gear to be stabilized at room temperature (20-25℃) to avoid thermal expansion effects, which can skew results. For example, if a gear is measured immediately after operation (when temperatures can reach 60-70℃), thermal expansion may cause a 0.02-0.03mm overestimation of tooth thickness, leading to incorrect wear assessments.
Backlash Detection Specifications (Feeler Gauge Method/Lead Wire Method)
Backlash— the small gap between meshing gear teeth— is essential for preventing gear jamming and accommodating thermal expansion. Too little backlash causes excessive friction and heat, while too much leads to impact noise and accelerated wear. The standardized backlash range for cone crusher gears is 0.15-0.4mm, and two common methods are used to measure it: the feeler gauge method and the lead wire method.
The feeler gauge method involves inserting thin, calibrated metal strips (feeler gauges) into the gap between meshing teeth at three equally spaced points around the gear. The thickest gauge that fits without force is recorded as the backlash. This method is quick and straightforward but requires careful alignment to ensure the gauge is inserted perpendicular to the tooth surface. For example, if the gauge is tilted, it may give a false reading that is 10-15% higher than the actual backlash. The lead wire method, by contrast, uses soft lead wires (0.2-0.5mm diameter, matching the expected backlash range) placed between meshing teeth. When the gears are rotated, the wires are flattened, and their thickness is measured with a micrometer to determine backlash. This method is more accurate for irregular tooth profiles and is often used for annual precision inspections.
Vibration Spectrum Analysis (FFT Transformation)
Vibration spectrum analysis is a powerful dynamic method for detecting early-stage gear wear, as it captures subtle changes in vibration patterns caused by internal defects. The process involves collecting vibration data using sensors mounted on the gearbox, then applying a Fast Fourier Transform (FFT) to convert time-domain vibration signals into frequency-domain spectra. This transformation reveals characteristic "fault frequencies" that correspond to specific gear issues—such as gear meshing frequency (GMF), which is calculated as (number of teeth × rotational speed)/60.
For cone crushers operating at a typical rotational speed of 1500rpm, a gear with 20 teeth would have a GMF of 500Hz. In a healthy gear system, the GMF peak in the spectrum is sharp and low-amplitude (vibration velocity<2.8mm/s, per ISO 10816). As wear progresses—for example, due to pitting or tooth damage—the GMF peak broadens and increases in amplitude; amplitudes exceeding 4.5mm/s indicate significant wear. Additionally, sidebands (small peaks around the GMF) may appear, signaling issues like gear misalignment or bearing damage. This method is particularly valuable for mining and quarrying applications, where cone crushers run continuously and unplanned downtime can result in substantial production losses.
Detection Tools and Equipment
The accuracy and reliability of gear wear detection depend heavily on the quality and calibration of the tools used. From precision alignment tools to vibration sensors and oil analysis equipment, each device serves a unique purpose in capturing data about gear health. Properly maintained and calibrated tools ensure that measurements are consistent, repeatable, and compliant with industry standards. This section outlines the key tools for cone crusher gear testing, their technical specifications, and best practices for their use.
Laser Alignment Tool Accuracy Requirements (<0.01mm)
Gear misalignment is a major cause of premature wear in cone crushers, as it creates uneven contact between teeth and increases stress on specific areas. Laser alignment tools are used to ensure that the gear shaft and main shaft are perfectly aligned, with an accuracy requirement of<0.01mm. These tools use two laser transmitters mounted on the shafts, which emit beams to a receiver that measures horizontal and angular offsets. The data is displayed in real time, allowing technicians to adjust the shafts until alignment is within the acceptable range.
Before use, laser alignment tools must be calibrated annually to maintain accuracy. Calibration involves testing the tool against a reference standard with known offsets (e.g., 0.005mm, 0.01mm) to ensure readings are within ±0.001mm of the true value. During alignment, the gearbox must be in a stable condition—free from external vibrations and at ambient temperature—to avoid false readings. For example, if the crusher is still running or has just been shut down, residual vibrations can cause the laser beam to fluctuate, leading to alignment errors of up to 0.02mm. Proper alignment reduces gear wear by 30-40%, according to industry studies, making laser alignment tools a critical investment for long-term gear health.
Vibration Sensor Placement (Horizontal/Vertical/Axial)
Vibration sensors (accelerometers) are essential for capturing dynamic data about gear performance, and their placement directly impacts the quality of the data. For cone crusher gearboxes, sensors are mounted in three directions—horizontal, vertical, and axial—on the bearing housings closest to the gear set. This ensures that vibrations from gear meshing, bearing wear, and shaft misalignment are all captured.
The horizontal direction measures lateral vibrations caused by gear misalignment or unbalanced shafts, while the vertical direction captures vibrations from gravitational loads and uneven wear. The axial direction detects thrust forces, which can indicate issues with the gear’s axial clearance. Sensors should be mounted using magnetic bases or threaded studs to ensure firm contact—loose mounting can dampen vibrations and reduce signal accuracy by 20-30%. Additionally, sensors must have a frequency range of 10-10000Hz to cover the typical fault frequencies of cone crusher gears (e.g., GMF up to 1000Hz and bearing frequencies up to 5000Hz). For example, a sensor with a lower frequency limit of 50Hz would miss early-stage bearing wear signals, which often appear at 20-40Hz.
Oil Ferrography Analyzers (Rotary/Analytical)
Oil ferrography analyzers detect metal particles in the gearbox oil, which are direct indicators of gear wear. These particles are generated as gear teeth rub against each other, and their size, shape, and concentration reveal the type and severity of wear. There are two main types of ferrography analyzers: rotary and analytical.
Rotary ferrography analyzers are portable and used for on-site screening. They spin a sample of oil on a glass slide, using a magnetic field to separate ferrous particles. Technicians then examine the slide under a microscope to count particles and assess their size—particles larger than 50μm indicate severe wear, while particles 5-20μm suggest normal, mild wear. Analytical ferrography analyzers, by contrast, are laboratory-based and provide quantitative data, such as particle concentration (in parts per million, ppm) and particle type (e.g., cutting, fatigue, or corrosion). For cone crushers, the acceptable particle concentration is<20ppm; concentrations exceeding 30ppm require immediate oil changes and further gear inspection. This method is particularly useful for monitoring wear in the crushing chamber, as particles from chamber liners can also contaminate the oil and affect gear performance.
Temperature Recorder Calibration (±1℃ Accuracy)
Temperature is a key indicator of gear health—unusual temperature spikes often signal excessive friction from wear or poor lubrication. Temperature recorders (thermocouples or infrared sensors) are used to monitor gearbox temperature, with a calibration requirement of ±1℃ to ensure accurate readings. Calibration is typically performed every 6 months using a dry-block calibrator, which maintains a stable temperature (e.g., 40℃, 60℃, 80℃) for the recorder to measure.
Temperature recorders are mounted on the gearbox housing, 2-3cm away from the bearing seats, as this area most accurately reflects internal gear temperature. The normal operating temperature range for cone crusher gearboxes is 40-60℃; temperatures exceeding 70℃ trigger an alarm, as this indicates potential issues like insufficient lubrication or excessive backlash. For example, if the temperature rises from 50℃ to 65℃ over a week without a change in load, it may signal a reduction in oil viscosity (which decreases lubrication efficiency) or early-stage tooth wear. Regular temperature monitoring, combined with calibration, helps detect these issues before they lead to catastrophic gear failure.
Wear Severity Evaluation Standards
To ensure consistent and objective assessments of gear wear, industry-specific standards have been developed to quantify wear severity. These standards cover everything from tooth surface fatigue to dimensional deviations, providing clear thresholds for "normal," "warning," and "critical" wear levels. Adhering to these standards helps technicians make informed decisions about maintenance—whether to continue operation, perform minor repairs, or replace the gear entirely. This section outlines the key standards used in cone crusher gear evaluation, along with practical examples of how to apply them.
Tooth Surface Contact Fatigue Ratings (AGMA 9-FTM)
The American Gear Manufacturers Association (AGMA) 9-FTM standard classifies tooth surface contact fatigue into five levels, based on the extent of pitting, spalling, and scoring. Level 0 indicates no fatigue damage— the tooth surface is smooth and free of defects. Level 1 shows minor pitting (less than 1% of the tooth surface), which is considered normal for gears in early operation. Level 2 involves moderate pitting (1-5% of the surface), signaling the need for increased monitoring. Level 3 includes significant pitting (5-10%) or minor spalling, requiring immediate inspection of lubrication and alignment. Level 4, the most severe, involves extensive spalling (over 10%) or tooth breakage, which necessitates gear replacement.
This standard is particularly relevant for S-series spring cone crushers, which operate under high loads and are prone to contact fatigue. For example, a spring cone crusher processing basalt (a hard, abrasive material) may experience Level 1 fatigue after 6 months of operation—this is acceptable, but technicians should increase vibration monitoring frequency. If the fatigue progresses to Level 3 within the next 3 months, it may indicate that the gear’s surface hardness is insufficient (should be HRC 58-62 for this application) or that the lubricant is contaminated. By referencing AGMA 9-FTM, technicians can avoid overreacting to minor wear or underestimating severe damage.
Pitting Area Ratio (<5% as Acceptable)
Pitting area ratio— the percentage of the tooth surface covered by pitting— is a critical metric for evaluating surface wear. The industry standard specifies that a pitting area ratio of<5% is acceptable for cone crusher gears; ratios between 5-10% are a "warning" (requiring weekly monitoring), and ratios exceeding 10% are "critical" (requiring gear replacement). To calculate this ratio, technicians use a grid method: the tooth surface is divided into 100 equal small squares (e.g., 5mm × 5mm), and the number of squares containing pitting is counted.
For example, a gear tooth with 3 squares of pitting has a ratio of 3% (acceptable), while a tooth with 7 squares has a ratio of 7% (warning). It is important to measure the pitting area on multiple teeth (at least 5-10% of the total number of teeth) to ensure a representative sample. Additionally, pitting location matters—pitting on the tooth tip or root is more severe than on the mid-tooth, as these areas experience higher stress. For instance, pitting on the tooth root (which has a smaller radius and higher stress concentration) can lead to tooth breakage if not addressed, even if the total pitting area ratio is below 5%.
Tooth Root Fillet Wear Amount (<0.2mm)
The tooth root fillet— the curved area where the tooth meets the gear hub— is a critical stress concentration point. Wear in this area reduces the gear’s load-bearing capacity and increases the risk of tooth breakage. The standard for tooth root fillet wear specifies that the maximum allowable wear amount is<0.2mm. This measurement is taken using a contour gauge or a CMM, which maps the fillet profile and compares it to the original design dimensions.
The tooth root fillet’s original radius is typically 0.5-1.0mm for cone crusher gears; wear reduces this radius, creating a sharper edge that concentrates stress. For example, if the original fillet radius is 0.8mm and wear reduces it to 0.6mm, the wear amount is 0.2mm (the maximum allowable limit). If wear exceeds 0.2mm (e.g., to 0.5mm), the stress on the fillet increases by 25-30%, according to finite element analysis (FEA) studies. This increased stress can lead to fatigue cracks, which propagate over time and cause tooth breakage. Factors that accelerate fillet wear include excessive feed size (which increases gear load) and poor lubrication (which reduces film thickness between teeth). Regular measurement of fillet wear helps prevent unexpected gear failure.
Backlash Allowable Range (0.15-0.4mm)
As previously noted, backlash is the gap between meshing teeth, and its allowable range for cone crusher gears is 0.15-0.4mm. This range is determined by the gear’s module (tooth size) and operating temperature—larger modules and higher temperatures require larger backlash to accommodate thermal expansion. Backlash below 0.15mm causes "tight meshing," which increases friction and heat, leading to accelerated wear and potential gear jamming. Backlash above 0.4mm, by contrast, causes "loose meshing," which results in impact noise, vibration, and uneven tooth contact.
To ensure backlash stays within the allowable range, measurements should be taken at ambient temperature (20-25℃), as temperature changes affect backlash by 0.01-0.02mm per 10℃. For example, if backlash is measured at 0.2mm at 25℃, it may decrease to 0.18mm at 15℃ (due to thermal contraction) or increase to 0.22mm at 35℃ (due to thermal expansion). Technicians must account for this when evaluating backlash— a measurement of 0.14mm at 15℃ may be acceptable, as it would increase to 0.16mm at operating temperature (40-60℃). Regular backlash checks, combined with temperature monitoring, ensure that the gear system operates within safe limits.
Detection Cycles and Workflows
Gear wear detection is not a one-time task— it requires a structured schedule of inspections, from daily quick checks to annual precision tests. This cycle-based approach ensures that wear is detected early, before it escalates into a major issue, and that maintenance efforts are focused and efficient. Each cycle (daily, weekly, monthly, annual) has specific goals and tasks, designed to balance thoroughness with operational needs. For example, daily checks focus on easily observable indicators like temperature and noise, while annual tests involve detailed disassembly and precision measurements. This section outlines the key components of each detection cycle and how they fit together into a comprehensive workflow.
Daily Inspection Items (Temperature/Noise)
Daily inspections are quick, 5-10 minute checks designed to identify immediate issues that could affect gear performance. The two primary items checked are gearbox temperature and operating noise. Temperature is measured using an infrared thermometer, pointed at the gearbox housing near the bearing seats (as discussed earlier). The normal temperature range is 40-60℃; any temperature above 70℃ or a sudden increase of 10℃ or more since the previous day requires further investigation.
Noise is evaluated using a sound level meter, which measures noise in decibels (dB) at a distance of 1 meter from the gearbox. The normal operating noise for cone crushers is<85dB; noise levels exceeding 90dB indicate potential problems like excessive backlash, gear misalignment, or bearing wear. For example, a sudden increase from 82dB to 88dB may signal that a tooth has developed a small chip, causing impact between meshing teeth. Daily inspections are particularly important in aggregate processing, where cone crushers run for 8-12 hours per day— even minor issues can escalate quickly under continuous operation. Technicians should record temperature and noise readings in a logbook to track trends over time.
Weekly Detection Tasks (Vibration Data Collection)
Weekly detection tasks focus on collecting vibration data, which provides early warning of internal wear. This task takes 30-45 minutes and involves using a vibration analyzer with sensors mounted in horizontal, vertical, and axial directions (as outlined in the tools section). Data is collected at the same time each week (e.g., Monday morning) to ensure consistency, as operating conditions (e.g., load, temperature) can vary throughout the week.
For each direction, three 10-second data samples are collected, and the average vibration velocity is calculated. The normal vibration velocity range for cone crusher gears is<2.8mm/s (per ISO 10816); velocities between 2.8-4.5mm/s are a warning, and velocities exceeding 4.5mm/s are critical. Additionally, technicians should compare weekly data to identify trends— a gradual increase in vibration velocity (e.g., from 2.5mm/s to 3.2mm/s over 4 weeks) indicates progressive wear, even if the current value is within the normal range. This trend analysis helps predict when maintenance will be needed, allowing for planned downtime instead of unplanned breakdowns. Data should be stored in a digital database, where it can be easily accessed for future reference and trend analysis.
Monthly In-Depth Detection (Oil Analysis)
Monthly in-depth detection involves oil analysis, which provides insights into internal wear and lubrication quality. This task takes 1-2 hours and includes collecting an oil sample, testing its properties, and analyzing ferrous particles (using a ferrography analyzer). Oil samples are collected from the gearbox’s drain port, after the crusher has been shut down for 30 minutes to allow particles to settle. A 50ml sample is typically collected, using a clean, dry container to avoid contamination.
The oil is tested for three key properties: viscosity, moisture content, and particle concentration. Viscosity (a measure of oil thickness) should remain within ±10% of the original value (e.g., ISO VG 46 oil should stay between 41.4-50.6 cSt at 40℃). Moisture content should be<0.1%, as water reduces lubrication efficiency and causes corrosion. Particle concentration (measured via ferrography) should be <20ppm. For example, if the oil’s viscosity drops from 46 cSt to 40 cSt (a 13% decrease) or moisture content rises to 0.2%, it indicates that the oil is degraded and needs to be replaced. Oil analysis also helps correlate wear with other factors— for instance, if particle concentration increases while discharge size becomes inconsistent, it may signal that wear in the crushing chamber is contaminating the oil and affecting the gears.
Annual Precision Detection (Gear Meshing Inspection)
Annual precision detection is a comprehensive, 4-6 hour inspection that involves partially disassembling the gearbox to examine gear meshing and internal components. The primary goal is to assess the quality of gear contact, identify hidden wear, and verify alignment. To inspect gear meshing, technicians apply a thin layer of red lead paste to the tooth surfaces, then rotate the gears by hand (or at low speed) to create contact marks. These marks show where the teeth make contact during operation.
The ideal contact mark should be centered on the tooth surface, covering 60-80% of the tooth width and 50-70% of the tooth height. Contact marks that are off-center (e.g., concentrated on the tooth tip or root) indicate misalignment or incorrect backlash. For example, a contact mark on the tooth tip suggests that backlash is too small, while a mark on the root indicates backlash is too large. During annual inspections, technicians also check the moveable cone alignment, as misalignment between the moveable cone and gear system can cause uneven meshing. Additionally, bearings are inspected for wear— play exceeding 0.05mm indicates bearing replacement is needed. Annual precision detection ensures that long-term wear issues are addressed, extending the gear’s service life by 2-3 years on average.
Data Analysis and Diagnosis
Collecting detection data is only the first step— the real value lies in analyzing this data to diagnose gear health and predict future wear. Data analysis involves interpreting patterns in vibration, temperature, oil, and dimensional measurements, then correlating these patterns with known gear defects. Advanced techniques like fault frequency analysis and wear trend modeling help technicians move from "reacting to failures" to "predicting maintenance needs." This section explains how to analyze different types of data, identify common gear faults, and use predictive models to optimize maintenance schedules.
Vibration Time-Domain Waveform Characteristics (Impact Pulses)
Vibration data is often visualized as a time-domain waveform— a graph of vibration amplitude (in g-force) over time. Healthy gears produce smooth, consistent waveforms with low amplitude (typically<0.5g). As wear develops, the waveform develops "impact pulses"— sharp, sudden increases in amplitude caused by irregularities like tooth chips, pitting, or bearing defects. These pulses are a key indicator of early-stage wear, as they occur when the damaged part of the tooth makes contact with the mating gear.
For example, a gear with a small tooth chip (1-2mm) will produce an impact pulse every time the chip passes through the meshing zone— if the gear rotates at 1500rpm (25 revolutions per second), the pulse will occur 25 times per second. The amplitude of these pulses increases with wear severity: a minor chip may cause pulses of 0.8-1.0g, while a large chip or spall may cause pulses of 1.5g or more. To distinguish between gear-related pulses and other vibrations (e.g., from the rotor), technicians compare waveforms from different sensor directions— gear-related pulses appear in all three directions (horizontal, vertical, axial), while rotor vibrations are more prominent in one direction. Analyzing time-domain waveforms allows for quick identification of mechanical defects, even before they appear in frequency-domain spectra.
Typical Fault Frequencies in Spectrum Diagrams (Gear Meshing Frequency)
Spectrum diagrams (frequency-domain plots) reveal characteristic fault frequencies that correspond to specific gear issues. The most important of these is the gear meshing frequency (GMF), calculated as (number of teeth × rotational speed)/60. For example, a gear with 24 teeth rotating at 1200rpm has a GMF of (24×1200)/60 = 480Hz. In a healthy gear system, the GMF peak is narrow and low-amplitude; as wear occurs, the peak broadens and increases in amplitude due to irregular tooth contact.
Other key fault frequencies include the tooth passing frequency (TPF, equal to GMF) and harmonic frequencies (2×GMF, 3×GMF, etc.). Sidebands— small peaks around the GMF— are another critical indicator: evenly spaced sidebands (separated by the gear’s rotational frequency) signal gear misalignment, while irregular sidebands indicate tooth damage. For example, if the GMF peak at 480Hz has sidebands at 470Hz and 490Hz (10Hz apart, equal to the gear’s rotational frequency of 1200rpm/60 = 20rpm? No, 1200rpm/60=20Hz— correction: sidebands at 460Hz and 500Hz, 20Hz apart), it indicates that the gear is misaligned. By comparing the spectrum to a "baseline" spectrum (taken when the gear is new), technicians can quantify wear severity— a GMF amplitude 3 times higher than the baseline indicates significant wear requiring repair.
Oil Ferrography Particle Morphology (Cutting/Fatigue/Corrosion)
Oil ferrography analysis not only measures particle concentration but also examines particle morphology (shape and size), which reveals the type of wear occurring. There are three main types of wear particles: cutting, fatigue, and corrosion particles. Each type has distinct characteristics that help diagnose the root cause of wear.
Cutting particles are irregularly shaped, with sharp edges, and range in size from 5-20μm. They are generated by sliding friction between metal surfaces— for example, if the gear’s surface hardening is insufficient, the teeth may scrape against each other, producing cutting particles. Fatigue particles are spherical or oval, with smooth surfaces, and range in size from 2-10μm. They form when repeated contact stress causes small cracks in the tooth surface, which break off into particles. Corrosion particles are small (1-5μm), irregular, and often have a reddish-brown color (from iron oxide). They are caused by water or contaminants in the oil, which react with the gear’s metal surface. For example, if oil moisture content exceeds 0.1%, corrosion particles will increase, indicating a need for oil replacement and seal inspection. By analyzing particle morphology, technicians can determine whether wear is due to mechanical issues (e.g., misalignment) or chemical issues (e.g., poor lubrication), allowing for targeted maintenance.
Wear Trend Prediction Models (Weibull Distribution)
Wear trend prediction models use historical detection data to estimate how much longer a gear will operate before reaching critical wear levels. The Weibull distribution is a commonly used model for this purpose, as it can accurately describe the failure rate of mechanical components— including gears— over time. The Weibull model uses three parameters: shape (β), scale (η), and location (γ). The shape parameter β indicates the failure rate trend: β < 1 means the failure rate decreases over time (early wear), β = 1 means the failure rate is constant (normal wear), and β > 1 means the failure rate increases over time (late wear, approaching failure).
To build a Weibull model for cone crusher gears, technicians collect 6-12 months of wear data (e.g., tooth thickness reduction, vibration amplitude, particle concentration). For example, if tooth thickness decreases by 0.05mm, 0.08mm, and 0.12mm over 3 months, the model can predict that the thickness will reach the critical limit of 0.2mm in another 4 months. The model’s accuracy improves with more data— using 12 months of data reduces prediction error to<10%. This type of prediction is particularly valuable for C&D waste recycling operations, where cone crushers process variable feed materials and wear rates can fluctuate. By predicting maintenance needs, operators can schedule downtime during low-production periods, minimizing disruptions and reducing costs.
Preventive Maintenance Measures
Preventive maintenance is the key to minimizing gear wear and extending the service life of cone crushers. Unlike reactive maintenance (repairing after failure), preventive maintenance addresses the root causes of wear— such as poor lubrication, misalignment, and excessive load— before they lead to damage. This section outlines practical, data-backed preventive measures, from optimizing lubrication systems to implementing load monitoring. Each measure is designed to be actionable, with clear specifications and best practices, ensuring that maintenance efforts are effective and efficient.
Lubrication System Optimization (Viscosity Adjustment)
The lubrication system plays a critical role in reducing gear wear— it creates a thin film of oil between meshing teeth, preventing direct metal-to-metal contact. Optimizing the lubrication system involves selecting the correct oil viscosity and replacing oil at regular intervals. Oil viscosity is determined by the operating temperature and gear load: lower temperatures require lower viscosity oil (e.g., ISO VG 32 for -10-0℃), moderate temperatures require medium viscosity (e.g., ISO VG 46 for 0-30℃), and higher temperatures require higher viscosity (e.g., ISO VG 68 for 30-50℃). Using oil with incorrect viscosity can reduce lubrication efficiency by 30-40%— for example, using ISO VG 68 oil in a cold environment (-5℃) will cause the oil to thicken, increasing friction and wear.
Oil replacement intervals are based on operating hours and oil condition— typically every 6 months or 500 operating hours, whichever comes first. However, if oil analysis reveals high moisture content (>0.1%) or particle concentration (>30ppm), the oil should be replaced immediately. Additionally, the lubrication system’s filters should be cleaned or replaced every 3 months to prevent contaminants from entering the gearbox. Proper lubrication optimization can reduce gear wear by 50-60%, according to industry studies. This is similar to how lubrication protects jaw crusher lining plates, where consistent oil film thickness prevents premature abrasion.
Gear Alignment Adjustment (Offset<0.05mm)
As discussed earlier, gear misalignment is a major cause of uneven wear. Preventive alignment adjustment ensures that the gear shaft and main shaft remain within the acceptable offset range of<0.05mm. This adjustment is performed using a laser alignment tool, following a standardized workflow: first, measure the horizontal and angular offsets; then, loosen the gearbox mounting bolts; adjust the shims under the gearbox to correct offsets; and finally, retighten the bolts and remeasure to confirm alignment.
Alignment should be checked every 3 months, or after any major maintenance (e.g., replacing the moveable cone or transmission shaft). For example, if a technician replaces the main shaft, the gear alignment may shift by 0.08mm— this exceeds the allowable offset and requires adjustment. After alignment, vibration data should be collected to verify improvement— a well-aligned gear system will have vibration velocity<2.8mm/s. Proper alignment not only reduces wear but also improves energy efficiency— misaligned gears can increase power consumption by 5-10%, as more energy is wasted on friction. By maintaining alignment within <0.05mm, operators can extend gear life and reduce operating costs.
Surface Hardening Treatment (Carburizing and Quenching)
Surface hardening treatment increases the wear resistance of gear teeth by making the surface harder while keeping the core ductile (to absorb impact). Carburizing and quenching is the most common method for cone crusher gears: the gear is heated to 900-950℃ in a carbon-rich atmosphere, allowing carbon to diffuse into the surface (0.8-1.2mm deep). The gear is then quenched (rapidly cooled in oil) to harden the surface, followed by tempering (heating to 150-200℃) to reduce brittleness. The result is a surface hardness of HRC 58-62 and a core hardness of HRC 30-35— ideal for withstanding the high contact stress of cone crusher operation.
Surface hardening should be performed during gear manufacturing, and the hardness should be checked annually using a portable hardness tester. If surface hardness drops below HRC 55 (due to wear), the gear should be re-hardened or replaced. This treatment is particularly important for gears used in granite crushing, where the hard, abrasive material accelerates tooth wear. For example, a gear without surface hardening may last 6-12 months in granite service, while a carburized and quenched gear can last 24-36 months. Additionally, after hardening, the gear teeth should be ground to a surface finish of Ra<1.6μm, which reduces friction and prevents early-stage pitting.
Load Monitoring System (Torque Sensor)
Excessive load is a leading cause of gear wear— when the crusher processes oversized or hard materials, the gear system must handle higher torque, which increases stress and friction. A load monitoring system, using a torque sensor, prevents overload by measuring the torque on the transmission shaft and triggering an alarm if it exceeds the safe limit. The torque sensor is mounted on the transmission shaft, with a measurement range of 0-500N·m and accuracy of ±1%. The safe torque limit for cone crusher gears is typically 100-300N·m, depending on the crusher size— torques exceeding 350N·m require immediate load reduction.
The load monitoring system works in real time: if the torque rises to 320N·m, the system sends a signal to the crusher’s control panel, which reduces the feed rate or stops the feeder temporarily. This prevents the gears from being subjected to excessive stress. The system also logs torque data over time, allowing technicians to identify load patterns— for example, if torque consistently spikes during morning operation, it may indicate that the crushing ratio is too high (oversized feed material). By adjusting the feed size or crushing ratio, operators can keep torque within the safe range, reducing wear. Installing a load monitoring system can reduce gear failure rates by 40-50%, making it a cost-effective preventive measure.